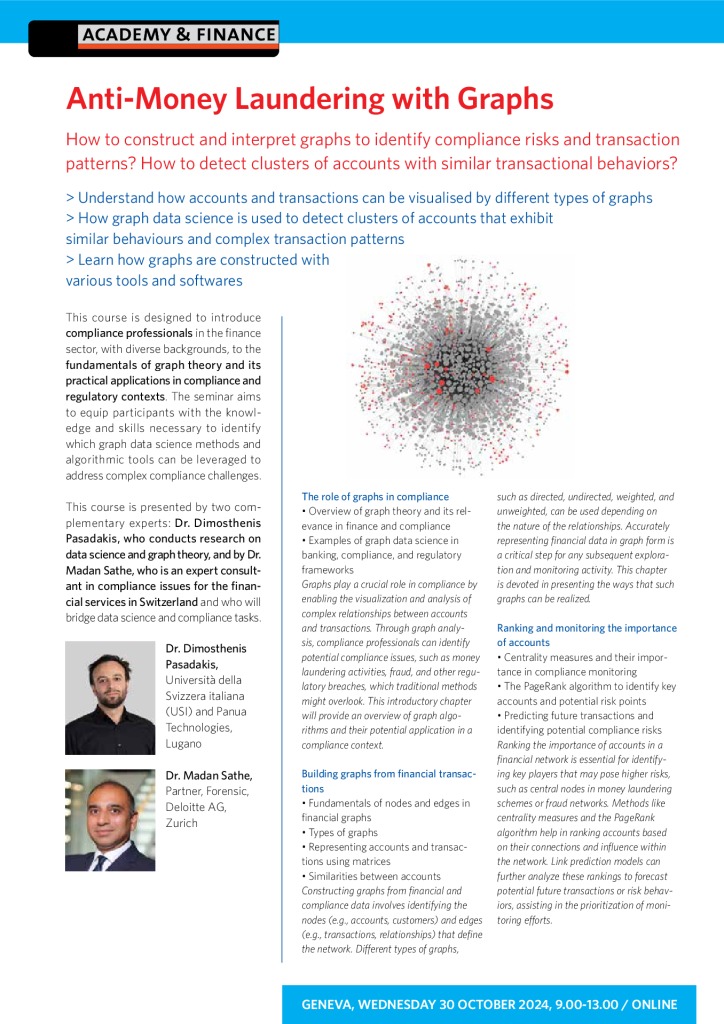
How to construct and interpret graphs to identify compliance risks and transaction patterns? How to detect clusters of accounts with similar transactional behaviors?
Understand how accounts and transactions can be visualised by different types of graphs
How graph data science is used to detect clusters of accounts that exhibit similar behaviours and complex transaction patterns
Learn how graphs are constructed with various tools and softwares
This course is designed to introduce compliance professionals in the finance sector, with diverse backgrounds, to the fundamentals of graph theory and its practical applications in compliance and regulatory contexts. The seminar aims to equip participants with the knowledge and skills necessary to identify which graph data science methods and algorithmic tools can be leveraged to address complex compliance challenges. This course is presented by two complementary experts: Dr. Dimosthenis Pasadakis, who conducts research on data science and graph theory, and by Dr. Madan Sathe, who is an expert consultant in compliance issues for the financial services in Switzerland and who will bridge data science and compliance tasks.
The role of graphs in compliance
- Overview of graph theory and its relevance in finance and compliance
- Examples of graph data science in banking, compliance, and regulatory
frameworks
Graphs play a crucial role in compliance by enabling the visualization and analysis of complex relationships between accounts and transactions. Through graph analysis, compliance professionals can identify potential compliance issues, such as money laundering activities, fraud, and other regulatory breaches, which traditional methods might overlook. This introductory chapter will provide an overview of graph algorithms and their potential application in a compliance context.
Building graphs from financial transactions
- Fundamentals of nodes and edges in financial graphs
- Types of graphs
- Representing accounts and transactions using matrices
- Similarities between accounts
- Constructing graphs from financial and compliance data involves identifying the nodes (e.g., accounts, customers) and edges (e.g., transactions, relationships) that define the network. Different types of graphs, such as directed, undirected, weighted, and unweighted, can be used depending on the nature of the relationships. Accurately representing financial data in graph form is a critical step for any subsequent exploration and monitoring activity. This chapter is devoted in presenting the ways that such graphs can be realized.
Ranking and monitoring the importance of accounts
- Centrality measures and their importance in compliance monitoring
- The PageRank algorithm to identify key accounts and potential risk points
- Predicting future transactions and identifying potential compliance risks
- Ranking the importance of accounts in a financial network is essential for identifying key players that may pose higher risks, such as central nodes in money laundering schemes or fraud networks. Methods like centrality measures and the PageRank algorithm help in ranking accounts based on their connections and influence within the network. Link prediction models can further analyze these rankings to forecast potential future transactions or risk behaviors, assisting in the prioritization of monitoring efforts.
Detecting financial communities and clusters
- Introduction to graph clustering and its applications in compliance
- Latent spectral information of networks
- Metrics for assessing the quality of detected communities
- Case studies and examples demonstrating the identification of suspicious clusters
Detecting communities within financial graphs helps compliance professionals identify clusters of accounts that exhibit similar behaviors or are tightly connected through a series of transactions. Graph clustering techniques can be used to detect such communities, which may indicate organized groups involved in illicit activities. Analyzing these clusters’ characteristics, such as size and connectivity, provides insights into the structure and potential risks posed by these groups.
Anti-Money Laundering (AML) with graphs
- Datasets and test cases
- Detecting fraudulent activity
- Graph-based anomaly detection for identifying money laundering schemes
Graphs are powerful tools in Anti-Money Laundering (AML) efforts, as they enable the identification of complex transaction patterns that may indicate money laundering. Techniques such as anomaly and community detection can be employed to flag suspicious activities within financial networks. Visualizing and analyzing these patterns helps compliance professionals better understand the flow of funds and identify attempts to obscure the origins of illicit money.
Tools and software
- Overview of graph analytic libraries and software
- Visualization options
Compliance professionals can utilize various tools and software for graph data analysis. These tools offer functionalities for graph construction, visualization, and analysis, allowing for a more intuitive understanding of complex financial networks. In this chapter we will review algorithmic frameworks that support such capabilities.
SPEAKERS
Dr. Dimosthenis Pasadakis, Università della Svizzera italiana (USI) and Panua Technologies, Lugano
Dr. Madan Sathe, Partner, Forensic, Deloitte AG, Zurich
Anti-Money Laundering with Graphs
I wish to see this past conference on zoom
Contact by the phone
ACADEMY & FINANCE SA
Rue Neuve-du-Molard 3
1204 Genève
Switzerland
T + 41 (0)22 849 01 11
E info@academyfinance.ch


